
Professional stock screening for DIY investors
The fundamental stock screener for investors who decide for themselves
Screen 55,000+ companies on 70+ exchanges, each measured 1,800+ ways: growth, stability, value and quality, against its own history and its industry. Your strategy, your decisions.
Start your free 2-week trial
Continue with Google2 weeks of full access, every feature included. No credit card, nothing to cancel.
Not ready yet? Look around without an account
- 55,000+companies
- 70+exchanges worldwide
- 1,800+metrics to screen and sort on
- 25–35 yrsof history (35 in the US)
One number, measured every way
Take free cash flow. Uncle Stock sets it against price, sales, earnings and debt, and gives those ratios their own growth, stability, averages and comparison with the industry. That is how a single company reaches 1,800+ metrics to screen and sort on.
Ratios built on free cash flow
- Free cash flow yieldvaluation
- Price / free cash flowvaluation
- Intrinsic value, discounted cash flowvalue model
- Free cash flow marginprofitability
- Free cash flow / EBITDAquality of earnings
- Free cash flow / long-term debtsolvency
Statistics derived from them
- Growth over the last year
1y growth - 5- and 10-year growth rate
5y CAGR - Trend growth, fitted over 5 and 15 years
15y rCAGR - Conservative growth, 67% likely to be beaten
15y rCAGR 67 - Stability of the yearly growth
15y yrly growth GSD - 3-, 5- and 10-year averages, per share
5y avg/share - Difference with the industry median
diff ind 5y CAGR
Scores
- Uncle Stock score
- Piotroski F-score
- Altman Z-score
- Beneish M-score
- Ohlson O-score
- Greenblatt
- Levermann
- Financial health
Valuation models
- Discounted cash flow
- Discounted dividend
- Residual income
- Buffett
Screener
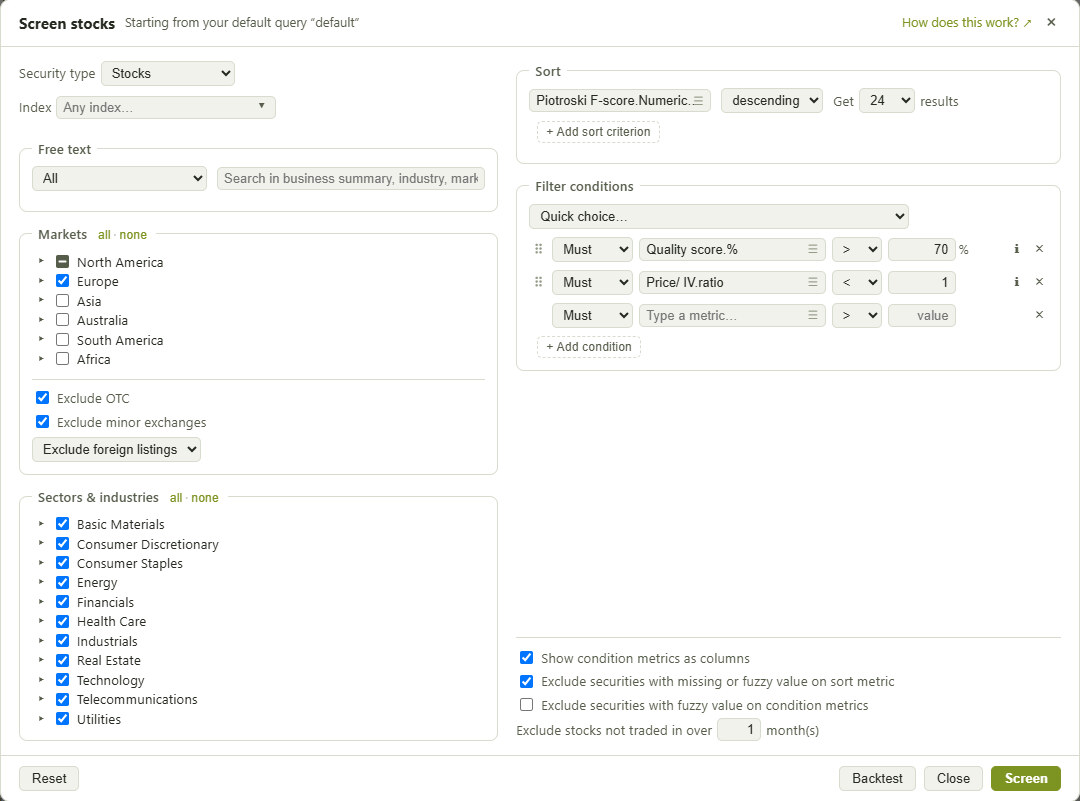
Screen the whole market with your own rules
Pick the markets and industries, add conditions on any metric (quality score, Piotroski F-score, price to intrinsic value, growth) and sort by what matters to you. The result is a list you can open, compare and keep.
Famous screens
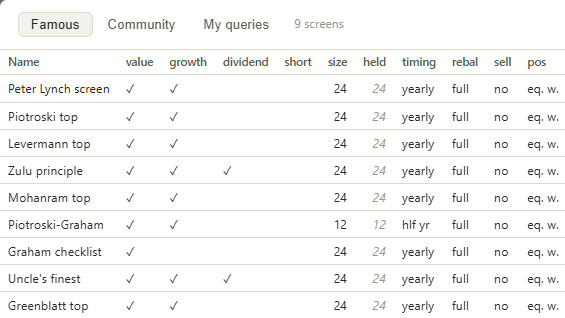
Start from the screens of famous investors
Peter Lynch, Piotroski, Graham, Greenblatt, Levermann, the Zulu principle: open one, see which stocks pass today, and change it into your own.
Backtesting
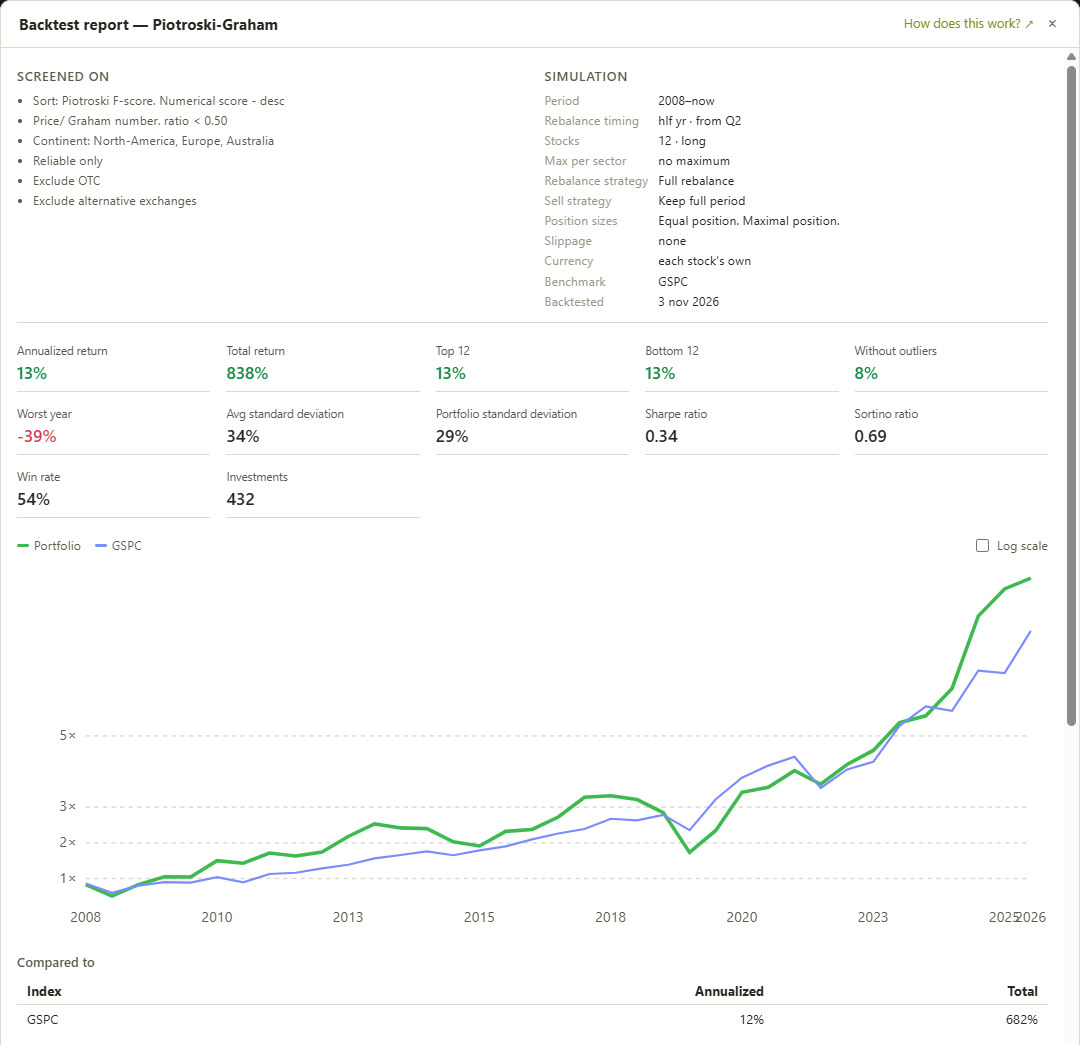
Backtest a screen before you trust it
See how your screen would have done since 2008, rebalanced yearly, half-yearly or quarterly, against an index such as the S&P 500: annual return, worst year, volatility and Sharpe ratio. Change the rules and run it again.
In the free trial and from Silver up. Past results are no guarantee of future returns.
Company pages
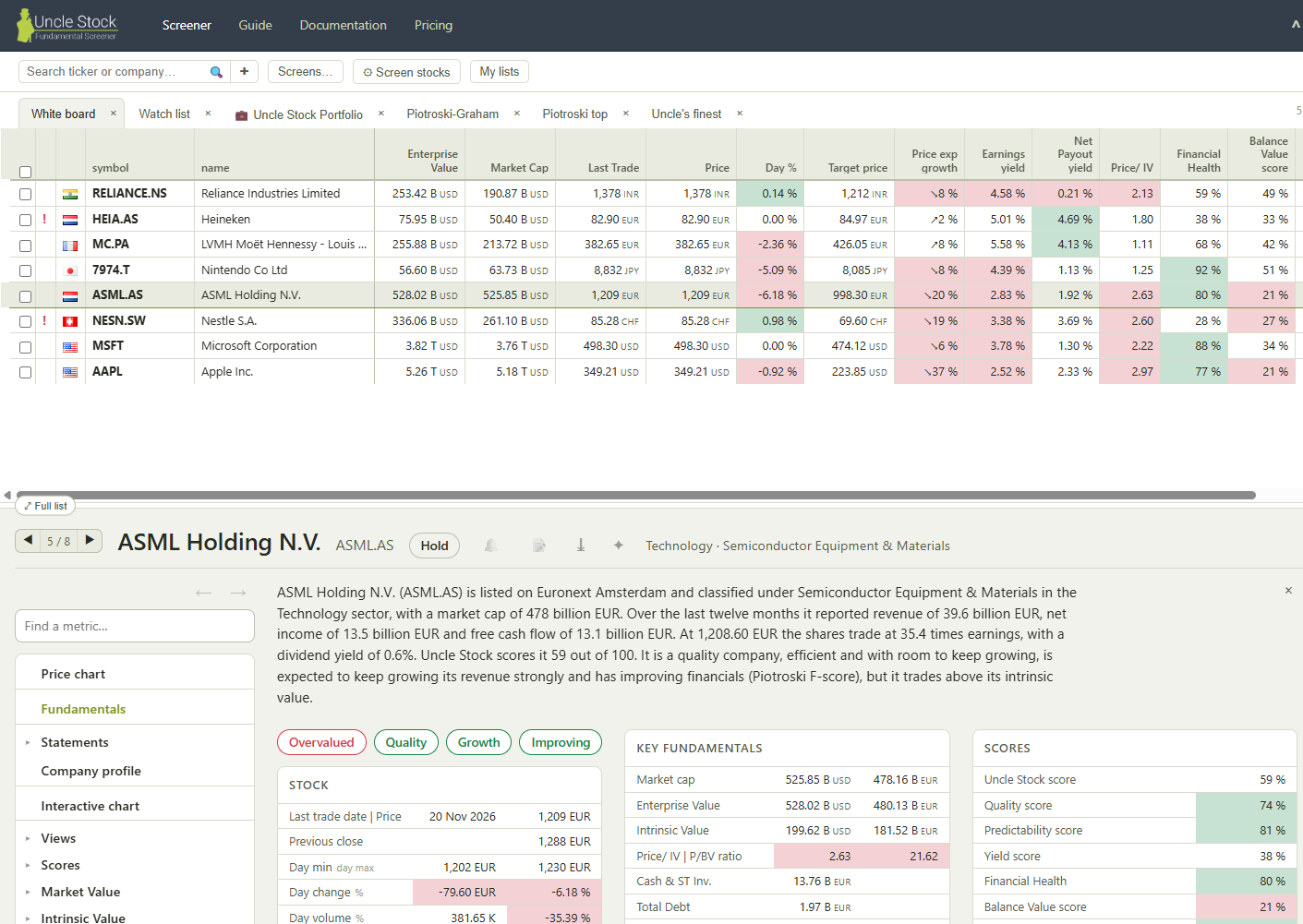
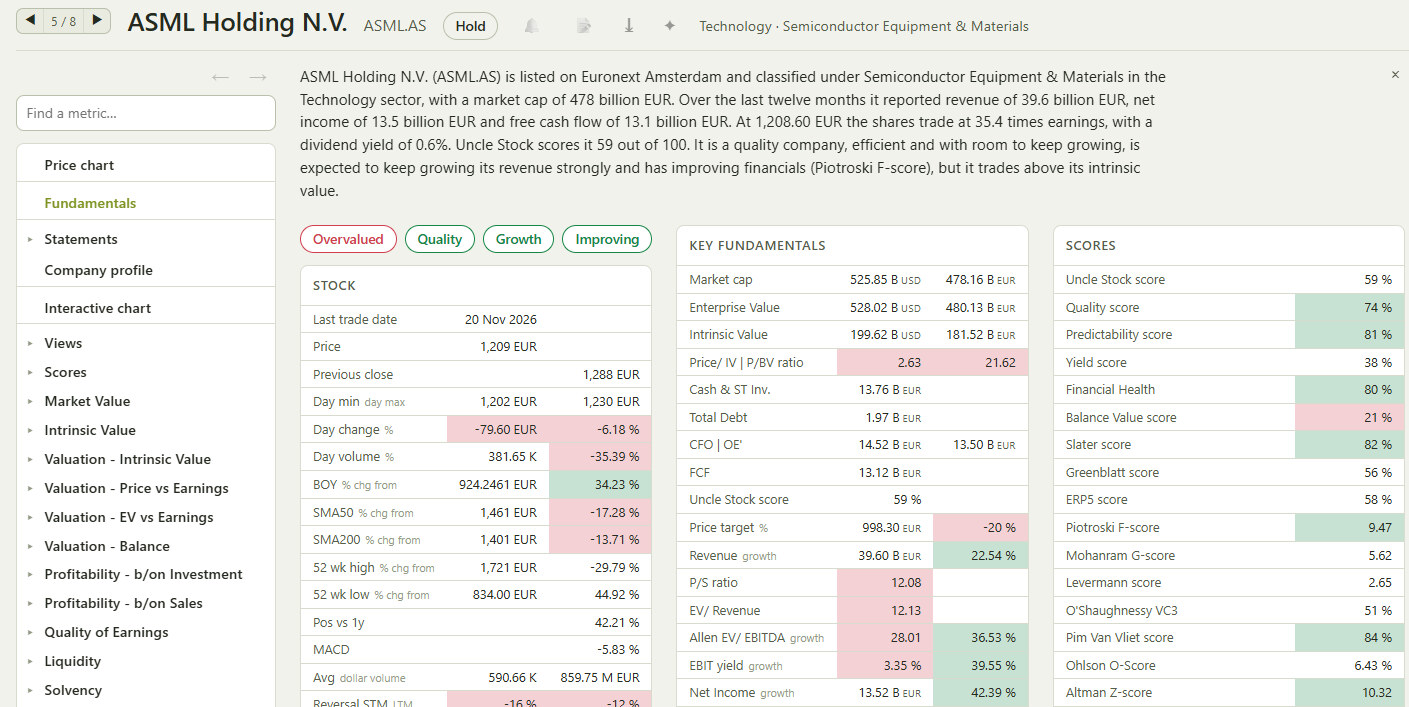
Read every company the same way
Valuation, profitability, solvency and quality of earnings on one page, for a company in Tokyo as for one in New York, with the statements and history behind every number.
AI assistants
Ask your AI assistant, answered with Uncle Stock data
Connect Claude, Cursor or another MCP client and screen the market in plain language. The assistant looks up the right metrics among 1,800+ and runs the screen on Uncle Stock's data, instead of guessing from memory.
5 AI searches a day for free, even without a plan; 75 a day with Gold. How to connect
“Find 8 fast, stable growers in India and South America at a reasonable price, with strong cash flows and a healthy balance sheet.”
find_metricrevenue growth, free cash flow, debt, valuationsearch_stocksIndia and South America, the chosen sectors, the criteria, ranked
MCP server https://www.unclestock.com/mcp
I subscribe to 8 programs and only use yours.
Uncle Stock deserves significant credit for my success in beating the market.
Used by investors in 50+ countries
Plans
Pick a plan when your free trial ends. Paying yearly costs about half.
Bronze
$20 / month
or $130 / year: save 46%
All data and the stock screener: scores, price targets, every indicator, predefined and shared screens, a watchlist.
Silver
$35 / month
or $210 / year: save 50%
Everything in Bronze, plus backtesting with yearly rebalancing, your own saved screens, the interactive fundamental chart and 200-day signals.
Gold
$60 / month
or $350 / year: save 51%
Everything in Silver, plus quarterly backtests, portfolio tracking with alerts, CSV and API export, and AI agent access (MCP).
Compare all features · Prices also in euro
Try every feature free for 2 weeks
No credit card. Nothing to cancel.