
Lesson 7
Track your portfolio Gold
By the end of this lesson Uncle Stock knows what you own, works out what it has returned across every currency involved, and e-mails you when something you are watching crosses a line you drew.
Everything in this lesson needs a Gold pack, and everything in it is private to your account.
1Record what you bought
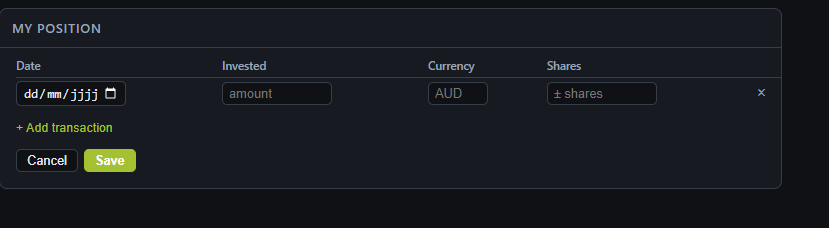
Open a company you own and go to its Price chart view. My position sits under the chart — where your holding belongs, next to what the share has been doing. Click Edit transactions and each trade becomes one row: the date, the amount you put in with its currency, and the number of shares.
A sale is a negative buy: put a minus in front of both the share count and the amount — the box even says ± shares. There is no separate sell row.
2What the summary tells you
Above the rows: how many shares you hold, what you put in, your average purchase price, what it is worth now, and your total return.
Currencies, handled properly
The currency selector converts the whole position. It is worth knowing exactly what it does, because this is where portfolio trackers usually cheat:
- Each amount you invested converts at the exchange rate of its own trade date — not today's. What you paid is a historical fact.
- Today's value converts at today's rate.
- The average purchase price stays in the currency the share is quoted in, whatever you pick. A price has one currency; converting it would produce a number that never existed.
3Tell Uncle Stock about your cash
A portfolio's return is not the average of its holdings. Cash that sat uninvested is part of the answer, and Uncle Stock cannot guess it.
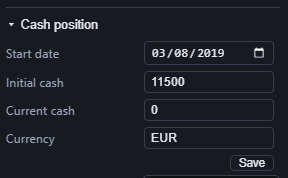
Open the account menu and expand Cash position. Four fields: the start date, the cash you began with, the cash you hold now, and the currency. The start date is what the yearly return is measured from, so set it to when you actually started.
This lives in the account menu, not with your transactions — it is one setting for your whole portfolio rather than one per company. Adjust the current cash after a trade, or the return drifts.
4The return of the whole list
Once every company in a list has a position, a chip appears above it with the list's return. Click it for the breakdown: the amount held, the profit or loss, the total return, and the yearly return — the same figure annualised from your cash start date.
Switch that list to the Trading view. It replaces the analysis columns with the ones a holder wants: what each position is worth, what it has made, and how much of the portfolio it is. That last one is the column that tells you a winner has quietly become a third of your money.
The chip only appears once the list is complete: every row needs a position. A list where half the companies are ones you are merely watching has no meaningful return to show, so Uncle Stock shows none. Keep the portfolio in its own list, separate from the watchlist.
5Alerts
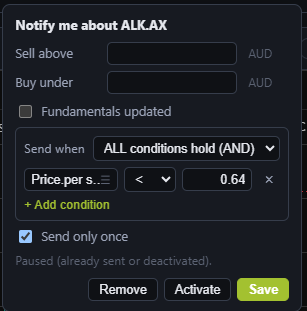
The 🔔 in a company's header sets up what Uncle Stock should tell you about it. You can set:
- a buy limit — mail me if the price falls under this;
- a sell limit — mail me if it rises above this;
- fundamentals updated — mail me when the company reports;
- or your own conditions on any metrics, joined with AND or OR.
Uncle Stock checks once a day and mails you when something matches. Rules can be switched off without deleting them, and Send only once stops a rule that has fired from mailing you every day until you change it.
Alerts arrive by e-mail, so Uncle Stock needs an address. Set it in the account menu — without one the rules run and nothing reaches you.
You also see it in the list
A crossed limit does not only send mail. In any list, a ▼ appears next to the ticker when the price is under your buy limit and a ▲ when it is over your sell limit, with the limit itself in the tooltip. The shapes carry the meaning as well as the colours, so they still work if you do not distinguish red from green.
That is the whole tour. The last page is a reference rather than a lesson: where everything from the classic client went.